About this Project
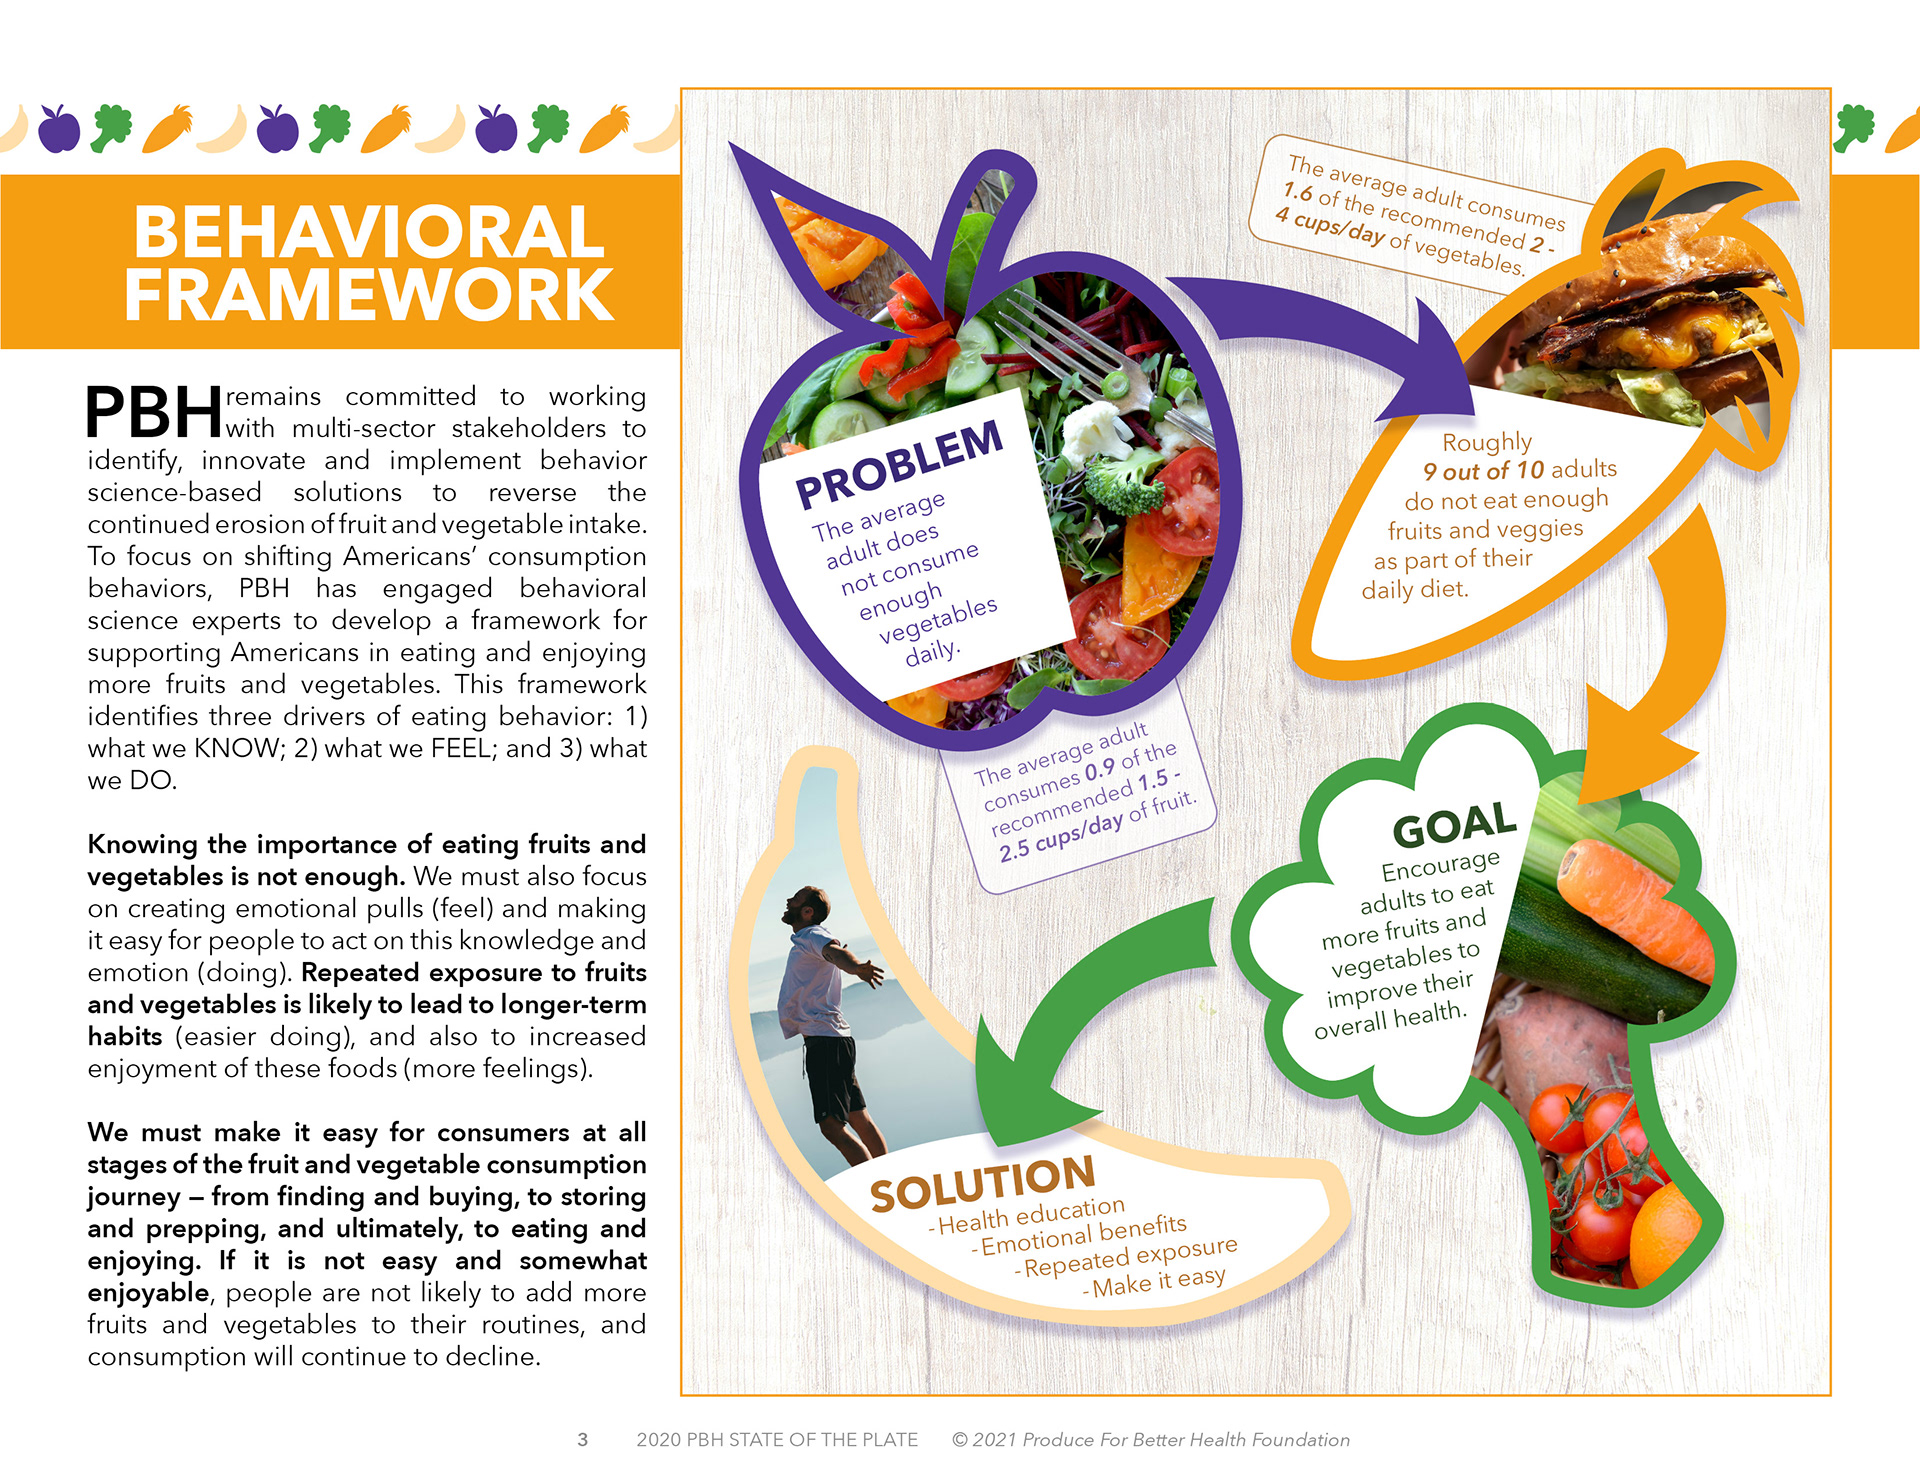
The report shown above was created as part of a larger class on combining aesthetics and technology as a graphic designer. Throughout the class I learned a great deal about what goes into designing and laying out graphs, charts, data, and relevant information that can be read and consumed in meaningful ways. To do this, the class was presented with information from the Produce for Better Health Foundation's 2020 State of the Plate report, where I gathered information and generated the imagery seen above using that data as inspiration.
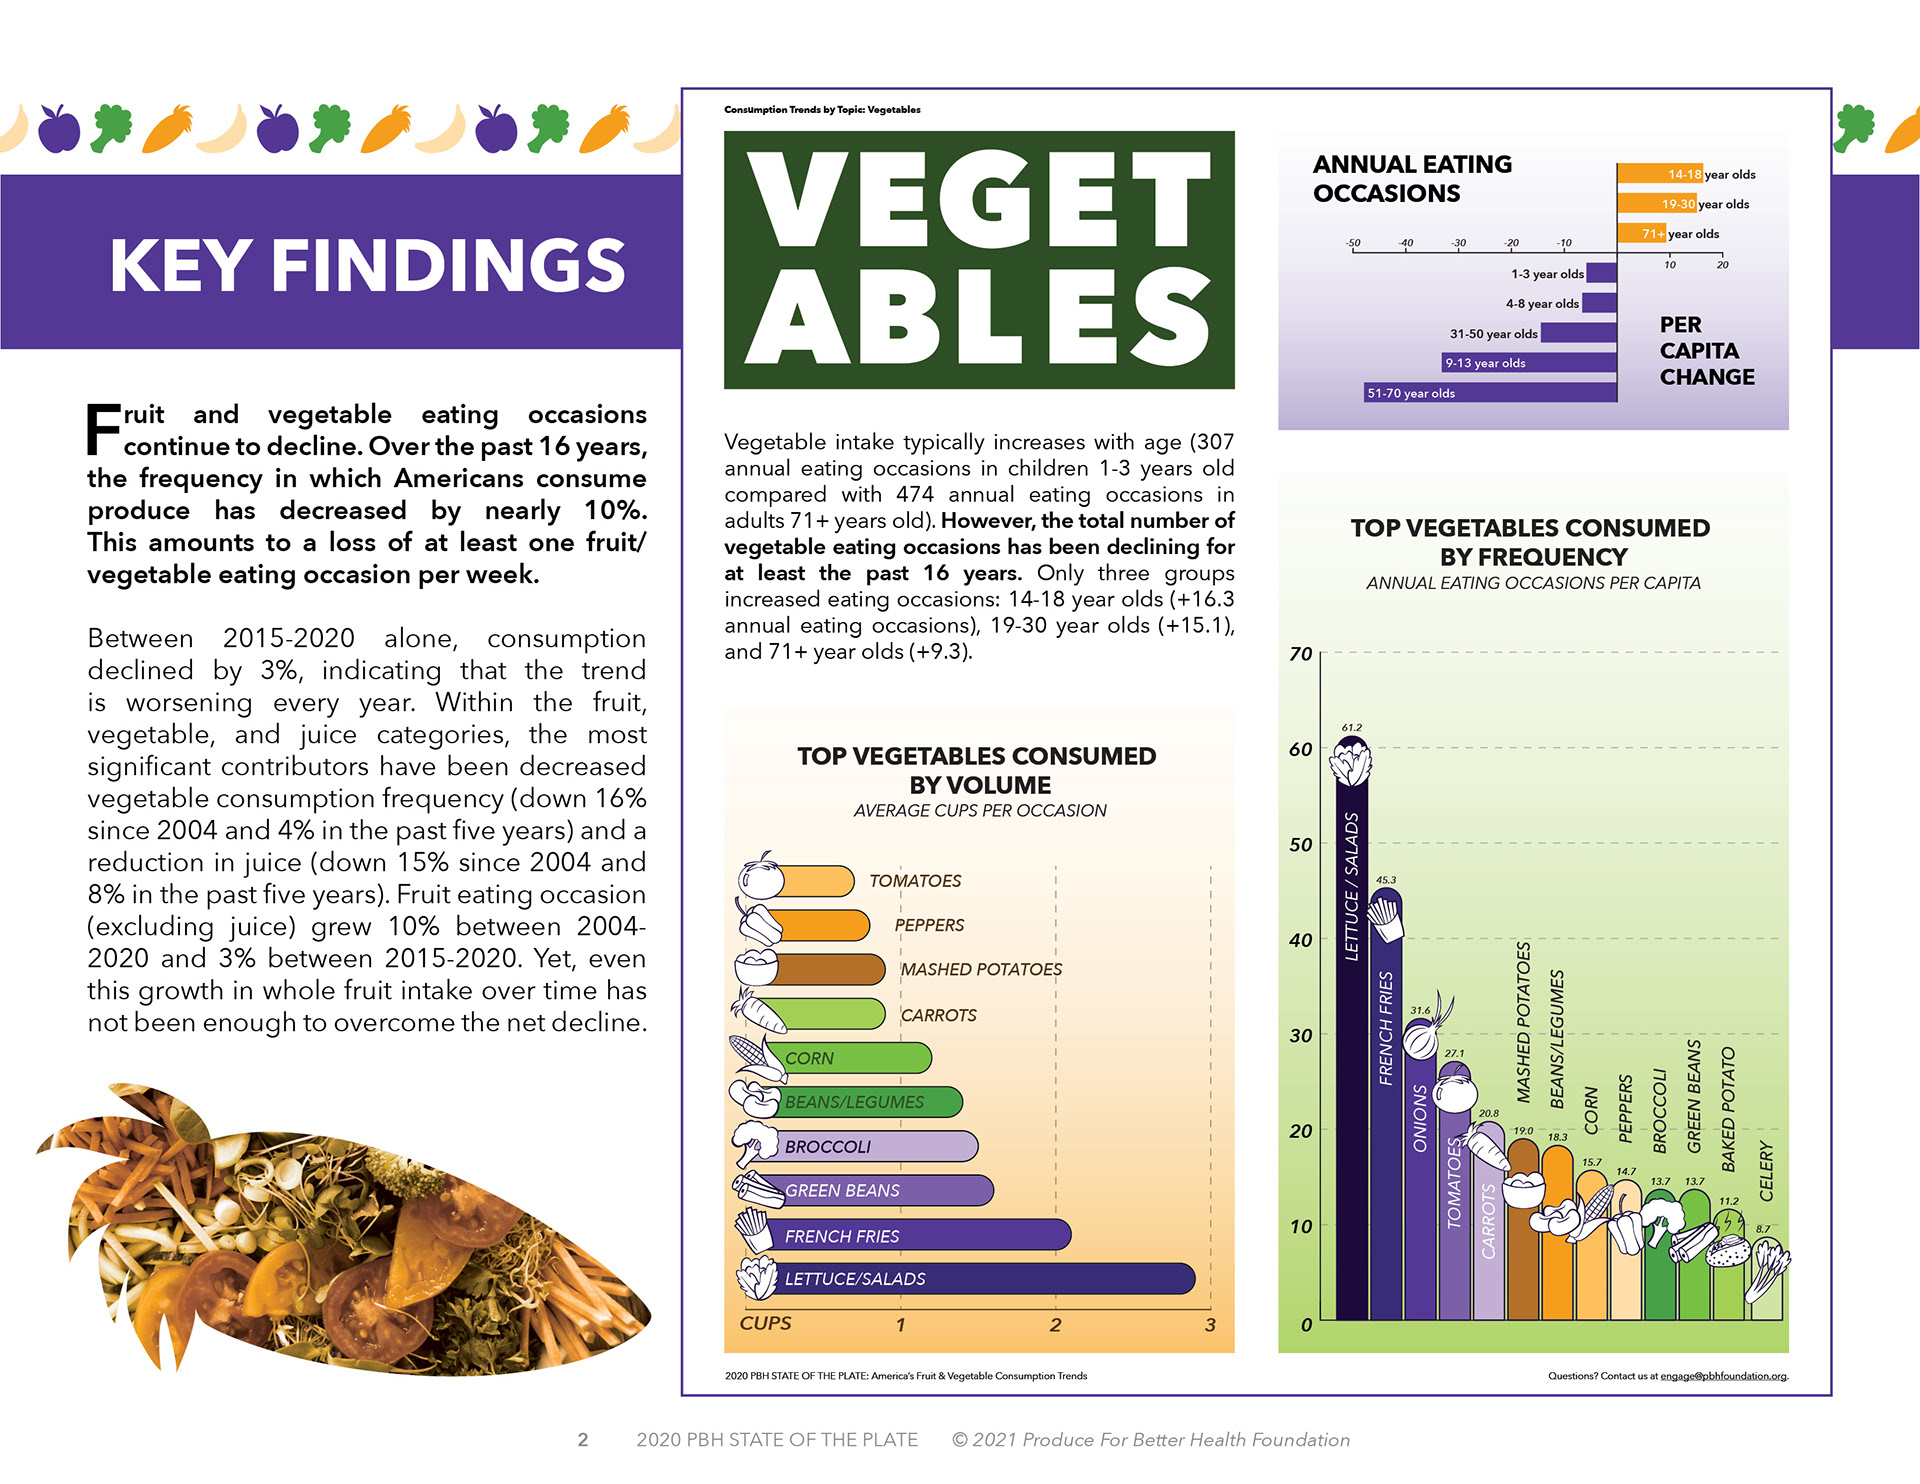
The graphs on page 2 were created using Adobe Illustrator while the layout of the report was designed using Adobe InDesign. Assets such as photographs and frames were created using Adobe Photoshop.
Note: This is a personal project and I made (or currently make) no money from the creation of this report. This is meant as personal practice and learning, using the 2020 PBH State of the Plate report's data for inspiration and written content. All written content belongs to Produce for Better Health Foundation.